What Are VJD and DLS Methods


VJD and DLS are statistical methods that have been introduced to aid calculation of a revised target to be chased by a team batting second in a rain-curtailed limited overs cricket match.
Contents
VJD vs DLS: History and Use
In this article, we look at how these two methods were invented and how useful they have proved.
The VJD Method
The VJD method was devised by and named after civil engineer V. Jayadevan from the Indian state of Kerala. Jayadevan realised the need for a new method of calculating targets for chasing teams in rain-hit matches and came up with a new method that sought to avoid some of the perceived weaknesses of the DLS method. Jayadevan invented the method as an alternative to the DLS method and submitted it to the ICC for use in place of the DLS. The method was adopted by the Indian Cricket League which was a precursor to the Indian Premier League. It was also used in the Tamil Nadu Premier League in India. Although there was an announced plan to use the VJD in the IPL seasons of 2011 and 2012, the plan was never implemented. The ICC rejected the method as an alternative to the DLS, stating that the method neither had any substantial improvements on the DLS nor did it establish the DLS method to be faulty.
The DLS Method
The Duckworth Lewis method was devised to set a new target when overs had to be reduced when a team batted second in a rain-affected game. As the name indicates, it was invented by two English statisticians James Duckworth and Tony Lewis. The two gentlemen thought of this method after a farcical outcome in a World Cup semifinal between South Africa and England in 1992.
Before the D/L method was devised, two other methods had been in use to set a target in a rain-curtailed game: the Average Run Rate method and the Most Productive Overs method. Under the ARR method, a revised target was set based on the average run rate the team batting second had been scoring at, without considering how many wickets were left.
Under the MPO method, the target was set based on the most productive overs enjoyed by the team batting first. This method not only ignored the number of wickets left with the team batting second but also did not give them credit for the best overs they bowled. Under both methods, the revised targets reached were unfair and skewed the result.
Getting back to the story of the World Cup semifinal in 1992, the match was interrupted by rain and South Africa were left with one ball to play and 21 runs to get after the ICC had applied the Most Productive Overs method. In effect, two overs were reduced while only one run was deducted from the original target, virtually handing the match to England. Under the DLS method devised by Duckworth and Lewis, South Africa would have been set a fairer target in the form of an achievable, however, difficult task of scoring four runs to tie the game and five runs to win it from the one ball left.
Duckworth and Lewis created their method in 1997 and gained ICC’s official acceptance in 1998. After the founders had retired, Professor Steve Smith became custodian of the method in 2014, which since then has been called the DLS method.
Under this method, the innings is divided into seven phases. These are settling down (overs 1-5), exploiting field restrictions (overs 6-15), stabilising the innings I (overs 16-25), stabilising the innings II (overs 26-25), beginning acceleration (overs 26-35), secondary acceleration (overs 36-45) and final slog (overs 46-50).
Based on these seven phases, Jayadevan developed mathematical models to describe the natural progression of the innings. In his method, the engineer made use of the concepts of normal scores and target scores.
In creating the method, he first compiled a data set of many closely fought games. He used the data sets to create regression equations that in turn helped him to make easy-to-use tables.
He also devised a user-friendly computer program (app) to help calculate the target score for a chasing team in a rain-interrupted game, in which the number of overs is reduced.
DLS Method of Calculation
The DLS method assumes that the scoring rate of the chasing team will improve with every over. Thus, according to this method, the rate of scoring will be higher in later overs than in the earlier ones. The DLS method also considers the number of wickets in hand at the time of the rain interruption, as well as the proportion of overs left to be bowled. You will get a better understanding of the method in the calculations provided further in this article.
Comparison of the Projected Target in Both Methods
Example 1
Consider a match in which the team batting first has made 280 runs in 50 overs. There is a rain interruption during the innings break and the team batting second is left with 40 overs.
As per the DLS method, the target score will be calculated using the following formula:
First innings score X (Percentage of resources with Team II/Percentage of resources with Team I).
Resources of Team I at the start of the innings is 100% (50 overs; 10 wickets)
Resources of Team II at the start of the innings is 90.4% (40 overs; 10 wickets)
See the chart below which gives the percentage for 40 overs with zero loss of wickets as 90.4.
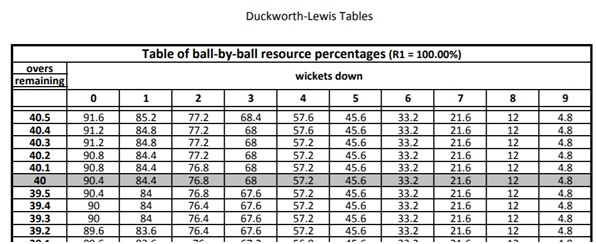
In the above instance, we get:
Target score = 280 X 90.4/100 = 253
 The target for the same match, using the VJD method will be calculated as follows:
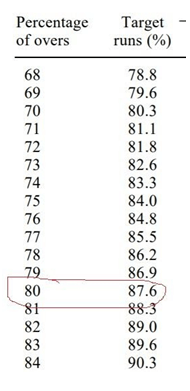
Only 40 overs are left. In other words, there are only 80 percent of overs left. As per the VJD table, the target percentage for 40 overs is 87.6.
Thus, the par score will be calculated, using the formula:
Target score = First innings score x Target percentage = 280 x 87.6/100 = 246
Example 2
Consider a second match in which Team 1 scores 300 in 50 overs. Rain interruption takes place when Team 2 has played 25 overs and lost two wickets. Using the VJD method, we get the par score for Team 2 to be 130.
Now, let’s see what the par score will be when using the DLS method:
Total resources available to Team 1 at the start of the match = 100% = R1
Total resources available to Team 2 at the start of its innings = 100%
Total resources available to Team 2 when play is abandoned = 61.6%
(The calculation is based on the DLS chart for 25 overs and 8 wickets)
Therefore, total resources available to Team 2 = R2 = 38.4%
Thus, par score = 300 x R2/R1 = 300 x 38.5/100 = 115.2 = 115 (rounded off).
As you can see, in this second instance, there is a huge difference between the par scores calculated with the help of two methods: as per the VJD method, the par score is 130 but according to the DLS method, it is only 115.
ExExample 3
am 1 scored 226/8 in 47.1 overs. We must calculate the par score for Team 2 in 33 overs.
As per the VJD method, the par score is 186.
Let’s see what the par score will be when the DLS method is implemented.
Resources available to Team 1 at the start of the innings = 100%
Resources lost by Team 2 (2 wickets and 2.5 overs) = 7.2%
Therefore R1 (Resources of Team 1) = 100 – 7.2 = 92.8%
R2 = Team 2’s resources (10 wickets and 33 overs) = 81.6%
Therefore, the par score = 226 + G50 x (R2 – R1)/100, where G50 is a par score of 225 for 50 overs as approved by the ICC.
This works out to 226 – 225×11.2 = 201
As you can see, there is a huge difference of 15 runs between the par score as per the VJD method (186) and the par score as per the DLS method (201).
Example 4Example 4
00/0 in 25 overs. What is the par score for Team 2 in 25 overs?As per the VJD method, the par score is computed as 157.
According to the DLS method:
Resources at start of Team 1 innings (50 overs, 10 wickets): 100%
Resources lost by Team 2 at start of interruption (25 overs, 10 wickets): 69.2%
Therefore, R1 = 30.8%
Resources of Team 2 at start of innings (25 overs, 10 wickets): 69.2%
Therefore, the par score as per the DLS method = 100 + 225x (69.2—30.8)/100= 186
Thus, there is a substantial difference in the par score calculated by the VJD method (157) compared with the calculation done according to the DLS method (186).
The Last WordThe Last Word
umptions made in VJD method appear more rational than those that form the basis of the DLS method. As the VJD is becoming popular in domestic tournaments in India, the day may not be far when it finds universal acceptance. Will the ICC take the bait?
Back in 2003 when T20 cricket was first played, nobody knew what to expect from it. It was not like a Test match or a One-Day International. It came to be known as the slam-bang version of the game. And this slam-bang version of the game had slightly different rules. Unlike in Test cricket […]
There are many deliveries in cricket that a batsman may find hard to deal with. A bouncer figures among such deliveries, as does an in-swinging ball or a googly that a batsman may not be able to read. However, there’s one ball most batsmen usually struggle to negotiate. That’s a yorker! What Is a […]

In cricket, as the current Laws specify, an over is defined as a set of six legitimate balls delivered by a bowler. A no-ball or a wide delivered by a bowler is considered illegitimate and is not considered in the six-ball count of an over with the bowler obliged to bowl another delivery instead. In […]

It is a terrible experience for a batsman to get out without scoring a single run in an innings aka scoring a duck. Not only does the batsman not get another chance to bat in the innings but it also feels terribly embarrassed to not having added even a single run to the team’s […]

Test cricket is the oldest format in the history of the game. It was 15 March 1877 that a Test cricket event first took place. Australia and England played the first-ever Test match at the Melbourne Cricket Ground (MCG). Today, more than 143 years since the first-ever Test match, we would like to take […]

Fielding restrictions have existed in cricket since the 1996 World Cup. The ICC introduced the term “powerplay” only in 2005. The rationale for fielding restrictions was based on motivating batsmen to score more runs. It can be noticed that ODI batting teams have been making more runs on average since 1996 than in the period […]